How can we help?
Related Pages
Get it Done


Dr Eric Rirsch
Safeguard Europe Ltd, Redkiln Close, Horsham, West Sussex, RH13 5QL, UK
Dr Zhongyi Zhang
Advanced Polymer and Composites (APC) Research Group, Department of Mechanical and Design Engineering, University of Portsmouth, Portsmouth, Hampshire, PO1 3DJ, UK
This paper briefly reviews the rising damp phenomenon with a discussion of the controlling mechanisms and contributing factors such as capillary effect, water absorption, evaporation and salt formation. It also presents the results of a study on rising damp based upon a practical year-long test. Measurements were made on rising damp on walls made from different mortars and the observations were compared with theoretical models. It was found that mortar characteristics would significantly affect the height of rising damp. It was also observed that there was a strong correlation between rising damp and the Sharp Front Model, and the rate of absorption of water into the mortar was a key factor in determining the height of the rising damp front. In addition, walls with rising damp treatment are warmer than their control counterparts due to a reduction in surface moisture evaporative cooling.
Rising damp is a well known phenomenon around the world and occurs when groundwater flows into the base of a construction and is allowed to rise through the pore structure. The dampness causes damage to the fabric of the house and can make a room feel cold and inhospitable¹.
Water is an essential part of the process of brick and mortar manufacturing. In brick production, the wet clay is moulded and then fired to produce a hard, silicate bound structure with a network of pores. The pores are the residual volume that the evaporating water has left behind². Likewise in cement mortar, a large volume of unreacted water evaporates in the mortar curing process and leaves a network of pores behind. Similar pore networks are found in many types of natural stone. Pores and voids are inherently present in these building materials. It is these networks that subsequently become the pathways through which groundwater can rise as shown in Figure 1³.
Water has a strong affinity with the capillaries present in materials such as brick, mortar and stone⁴. This affinity brings about the rise of water into the structure through the force of capillarity. The capillary suction or capillarity is greatest for small capillaries and inversely proportional to the pore radius as Jurin’s law describes¹. The height of rise of water in a capillary (h) is governed by the following equation:

The equation describes the relationship between pore size and height of rise. In the case of water, it has been found that when the pore size is 0.1 mm then the rise is 14 cm but when the size is 0.01 mm the rise can be 1.4 m. The pore size in bricks and mortar can be as small as 0.001 mm so there significant potential for rising damp⁴. Water rises in the structure of porous building materials through the process of capillarity. Further considerations are the rate of transport, which is influenced by the pore structure and viscous forces (see for example ⁵), and subsequent removal by evaporation.
Evaporation is an important factor in rising damp. The surface of an affected wall contains moisture that has risen from the ground and this moisture is then subject to evaporation. The factors controlling evaporation include:
Mason developed a model for rising damp where capillary rise and evaporation coexist in balance [6]. A series of equations describe the flow processes through the capillary structure which form an equilibrium with evaporation. With evaporation introduced, the height of rise is governed by the factors relating to capillary pores, wall thickness and evaporation rate. In principle, evaporation equilibrium is an n-shaped profile of water distribution. The equilibrium between capillarity and surface evaporation is schematically shown in Figure 2.


In a thin wall there is proportionally more evaporation than capillary rise which means that the height of the rising damp front is reduced. An increase in the evaporation rate, as may happen from greater surface temperatures in the summer months, will also result in a drop in the height of rise. Similarly, a reduction in the ground water level will also bring about a reduction in height of the rising damp front.
One problem highlighted by Mason is that the height of rise “increases by a factor of about seven between the first and perhaps the hundredth year of the lifetime of the wall”⁶. A tentative explanation is offered where slightly acidic water washes out free lime from the mortar to increase the flow process. Therefore, it is difficult to implement a test for rising damp with new mortars as these are not representative of the true situation in an older wall.
More recently, Hall & Hoff have developed the Sharp Front model for rising damp; it is so named because in the model the boundary between wet and dry parts of the wall is discrete or sharp⁷. This builds on the concept of balance between capillarity and evaporation. The equation which describes the height of rise is:

Where H = height of the rising damp front, S = sorptivity (the suction of water into the mortar), b = wall thickness, e = rate of evaporation per unit area of the wetted surface, θ = moisture content of the wetted region (the volume of water per unit volume material).
The equation demonstrates that the sorptivity of water into the material has a strong influence on the height of the rising damp front. It can be measured by partial immersion of the test material in water and recording the weight increase with time. The equation also shows that the height of the rising damp front doubles by increasing the wall thickness by a factor of four.
The slow process of absorption of water into the structure with subsequent evaporation leads to the gradual deposit of salts in the wall. The masonry acts as a filter system for impure water as the various soluble salts are drawn into the wall and then left behind. Some figures of salt levels were reported by Kyte as shown in Table 1⁸.
| Source | Chlorine PPM | Nitrate PPM |
|---|---|---|
| Groundwater (Rising Damp) | 12 | 50 |
| Tap water (Bucks) | 18 | 50 |
| Rainwater | <1 | 1 |
| Seawater | 18,000 | 10 |
TABLE 1: SOLUBLE CHLORIDE AND NITRATE CONTENTS IN WATER OF DIFFERENT SOURCES IN PARTS PER MILLION (AFTER KYTE ⁸).
In addition, the rising water can dissolve and redistribute the salts in the bricks and mortar allowing high concentrations of salt to build up. The consequences of the salt build-up are that;
(a) The salts can block the pores and capillaries through which the water evaporates and thereby push the rising damp front higher as also demonstrated in the above equation⁹.
(b) Moisture content is increased in the mortar from the hygroscopic nature of the salts with the possibility of attracting further moisture into the wall. This contribution would be relatively small in comparison with capillary moisture.
(c) Damage to the structure from constant dissolution and recrystallisation of certain salts is incurred by humidity and temperature changes. Sodium sulphate salts deposited from groundwater can be particularly destructive to buildings and monuments¹⁰.
Taking the comments by Mason into consideration that the permeability of the mortar appears to increase with age, two types of masonry wall were constructed. In the first wall, a low permeability mortar was used comprising ordinary Portland cement (CEM I) and building sand at a 1:5 ratio (volume) with a cement plasticiser. In the second wall, a more permeable mortar was made from a binder solution, powdered clay and building sand at 1:1:6 ratio (volume) respectively. This second mortar was considered to represent a permeable historic mortar where rising damp had occurred. A further paper in preparation aims to show how laboratory mortars compare with those found in the field.
The bricks used in construction were standard Hanson London Brick Flettons. Each wall consisted of six courses laid in stretching bond, with one course comprising three bricks in a single width. The walls were erected in plastic trays and left for 28 days to allow cure of the mortar. Local tap water was then poured into the plastic trays and allowed to rise into the structure.
At the start of the work, it was planned to make measurements of moisture in the walls using an electrical capacitance/resistance gauge as well as taking direct measurements by oven drying drilled samples. The former method, however, was found not to give reliable results possibly because of the presence of soluble conducting salts and so was abandoned. All measurements taken were therefore made by the oven drying method. Although this is more laborious, findings were considered to be more reliable.
Moisture content was measured by oven drying at 105°C to constant weight. Each result is from a sample of mortar taken by drilling out the mortar course and collecting the debris in a sealable plastic bag. The drilled zone was between the wall surface and wall centre as shown in Figure 3. ‘1B1’ refers to the mortar line just above the first course of brick, ‘1B2’ to the mortar above the second course, etc.
At the end of the test, the walls were dismantled and measurements of the moisture contents were made on mortar pieces and whole bricks. This was done in order to provide information on the overall moisture distribution in the wall.
The sorptivity of the mortar was measured by taking a sample piece of size 30 mm × 30 mm × 12 mm after dismantling the wall. The sample was oven dried at 50°C to constant weight, the edges sealed and then placed on a water laden sponge to record the water absorption with time. The sorptivity is the gradient of the graph of weight gain against square root of time.
Data loggers (DS type from Maxim Dallas) were placed in some of the test walls and the temperature and humidity recorded over a period of 6 months.

After filling the trays with water, a slowly progressing rising water front could soon be visually observed. By day 8, the front had reached the 3rd course of the brickwork with the porous mortar but was only at the first course for the low permeability recipe as shown in Figure 4. As time elapsed, the advancing water line continued to rise but became less distinct.
Efflorescent salts became visible on the brickwork over the course of the first month of wetting. Salt formation increased with time and was visible on both the brick and mortar surfaces. More salts were seen on the wall which had been constructed with the porous mortar and Figures 5 and 6 show the porous mortar wall after 4 weeks and 4 months respectively. Some salts can be seen on the top course of the brickwork after 4 months.
Salts were collected from both brick and mortar surfaces from each wall and Figure 7 shows a typical crystalline microstructure as observed by scanning electron microscopy.


The walls were allowed to reach a steady level of saturation over five months. The first measurements of moisture in the walls were then made. A second round of measurements was made in July 2008 after 11 months and the walls were then dismantled.
The results obtained from drilling samples of mortar are shown in Table 3. With the low permeability mortar wall (1B), the moisture content in the first course is 7.3 wt%. This quickly reduces when moving further up the wall to the 5th course (1B5) where the moisture is 1.8 wt%. In comparison, the more permeable mortar permits a greater rise of moisture further up the brick wall as well as having a higher moisture content in the first course. These data can be plotted graphically as shown in Figure 8.
Table 2: Test timescale.
| Month | Date | Task |
|---|---|---|
| 1 | Aug 2007 | Walls built |
| 2 | Sept 2007 | Water introduced |
| 7 | Feb 2008 | First measurement of moisture |
| 12 | July 2008 | Final measurement and dismantling |
Table 3: Influence of mortar type on moisture content.
| Low permeability | Moisture wt.% | High permeability | Moisture wt.% |
|---|---|---|---|
| 181 | 7.3 | 2A1 | 13.9 |
| 182 | 3.5 | 2A2 | 14.9 |
| 183 | 2.1 | 2A3 | 9.7 |
| 184 | 2.1 | 2A4 | 9.2 |
| 185 | 1.8 | 2A5 | 9.7 |
Table 3: Influence of mortar type on moisture content. Fig. 8. Difference in moisture profiles in two walls with different mortars.

The water distribution data obtained after dismantling the walls are shown in Figures 9 and 10. In the case of the low permeability mortar, the water level in the brickwork is quite low whereas it is much higher for the high permeability mortar. There is a significant difference in the height of the rising damp front in these two cases. Because the same type of bricks were used in each wall, the properties of the mortar are demonstrated to be dominant. It is also interesting to see that the distribution of water between the brick and mortar changes for both situations. In the high permeability mortar wall, the brick contains more water than the mortar but the opposite is true in the case of low permeability mortar wall. This could relate to differences in pore size distribution between brick and mortar.
Lastly, the moisture content data obtained by measurements on drilling specimens was compared with data from the dismantling of the wall sections as shown in Table 4. There is a difference between the two sets of values with lower moisture contents obtained by drilling, especially with the harder modern mortar. It is possible that evaporation losses during the drilling process could partly explain the difference and further study is recommended.

Note: There is more water in the mortar than the brick.

Note: There is more water in the brick than the mortar.
| Height (mm) | Low Permeability | High Permeability | ||
|---|---|---|---|---|
| Drilling | Dismantle | Drilling | Dismantle | |
| 400 | 1.8 | 3.1 | 5.5 | 6.7 |
| 320 | 2.1 | 3.7 | 6.0 | 7.6 |
| 240 | 2.1 | 4.1 | 11.4 | 8.3 |
| 160 | 3.5 | 6.4 | 9.3 | 9.8 |
| 80 | 7.3 | 11.7 | 11.6 | 14.0 |
Table 4: Values of moisture (wt.%) by different methods from two samples of each type.
The original idea when using the data logger was to monitor changes in humidity that occurred over time. However when the data was analysed, it was found that the %RH results were unreliable with no identifiable pattern to the data. A close examination of the recorded temperatures did reveal an interesting effect.
The simple temperature trace in Figure 11 shows a gradual increase over the 6 month period corresponding with warmer weather. Temperature measurements were also made on a wall that had been treated with a chemical damp-proofing course, “Dryzone” from Safeguard Europe Ltd, to prevent moisture from rising. This wall became warmer after the treatment (compared with the untreated control). The increased temperature is most likely due to the fact that the reduced amount of rising water resulted in less evaporative cooling. It has been widely recognised that water and moisture have high heat capacity and latent heat. The temperature difference is of the order of 0.5°C as shown in Figure 12. This warming effect by chemical treatment was small but significant. It is being further investigated due to its potential energy saving importance and results will be published in due course.
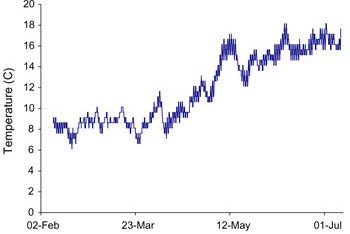
Temperature variation of test wall over six months.

Effect of reduced evaporation on wall temperature.
Looking at the findings on the importance of mortar on influencing rising damp, the experimental results can be compared with predictions from the Sharp Front model. Measurements were made of the sorptivity of the two mortars used and the results are shown in Figure 13.

The mortar sorptivities were measured as 1.2 mm/min (½) for the high permeability mortar and 0.25 mm/min (½) for the low permeability case. If the evaporation rate is estimated at 0.001 mm/min (Hall & Hoff) and the moisture content at 0.34 (calculated by volume porosity of 40% multiplied by capillary moisture fraction of 0.85), then given that the wall is 0.11 m wide, the predicted height of the rising damp front is 100 mm for the low permeability mortar and 480 mm for the high permeability case. It can be seen from Figures 9 and 10 that the observed estimates are approximately 80 mm and >480 mm, respectively. It should be noted that there might be errors in ascribing values to the terms in the equation. Taking this into consideration, the observed and predicted values are in remarkably good agreement.
Table 5: Comparison between predicted and observed values.
| Mortar Type | Height of Rising Damp Front | |
|---|---|---|
| Observed | Predicted | |
| Low Permeability Mortar | 80 mm | 100 mm |
| High Permeability Mortar | >480 mm | 480 mm |
Looking at the theory there are a number of different quantities that can be calculated as follows. For a wall consisting of a single thickness of brick (0.11 m) the quantities of water in walls with different mortars are listed in Table 6. The calculated results show that large quantities of water are present and move through walls by the process of rising damp. With a high permeability mortar the amount of water passing through one metre length of a single skin wall is of the order of 250 litres per year, which is a significantly high volume. The calculated residence time of the water in the wall is also given. This is the time taken for water to pass through the wall from sorption in the base to evaporation. The time in both cases is equal as the greater absorption rate in the higher permeability case is balanced by the further distance of travel.
Table 6: Calculated quantities of water in walls with different mortar.
| Low Permeability Mortar | High Permeability Mortar | |
|---|---|---|
| Total quantity of water/unit length of wall | 37 l/m | 18 l/m |
| Total flow through 1 m length of wall | 0.14 l/day (53 l/year) | 0.69 l/day (250 l/year) |
| Residence time of water in wall | 26 days | 26 days |
It is easy to see how high levels of salt can build up in a wall. A 50 ppm value of nitrate was found in groundwater from Kyte’s data in Table 1⁷. This equates to each litre of water containing 0.05 g nitrate. Hence, with the “old” mortar wall, an annual flow of 250 litres of water will deposit 12.5 g of nitrate in the wall each year.
Measurements on rising damp in walls made from different mortars were investigated and the conclusions can be drawn as follows:
The authors would like to thank Mr Graham Coleman for all discussions over the past two years on the subject of rising damp.

This article is also published in Construction and Building Materials 24 (2010) 1815–1820 www.journals.elsevier.com/construction-and-building-materials
| 1. | Alfano G., et al., Long-term performance of chemical DPCs: Twelve years of laboratory testing. Build. & Env. 2005. 41. p. 1060-1069. |
| 2. | Monteiro S.N., Vieira C.M.F., Solid state sintering of red ceramics at lower temperatures. Ceramics Int. 2004. 30. p. 381-387. |
| 3. | Cultrone G., et al., Influence of mineralogy and firing temperature on the porosity of bricks. J. of the European Ceramic. Soc. 24. 2004. p. 547-564. |
| 4. | Raimondo M., et al., Predicting the initial rate of water absorption in clay bricks. Construction and Build. Mater.. 2009. 23. p. 2623-2630. |
| 5. | Fries N., Dreyer M., Dimensionless scaling methods for capillary rise. J. of Col. and Interface Sci. 2009 338 p. 514-518 |
| 6. | Mason G., Rising Damp. Build. Sci. Oxford; Pergamon Press. 1974. 9. p. 227-231. |
| 7. | Hall C. & Hoff W.D., Proc. R. Soc A., 2007. 463. p. 1871-1884. |
| 8. | Kyte C.T., Laboratory Analysis as an aid to diagnosing Rising Damp. Tech. Information Paper 35, Ascot; Chartered Institute of Building. 1987. |
| 9. | Oliver A., Dampness in Buildings. Oxford; BSP Professional Books, ISBN 0-632-01932-8. 1988. |
| 10. | De Clercq H., Proceedings from the Conference on Salt Weathering on Buildings and Stone Sculptures, Copenhagen. Tech. University of Denmark, ISBN: 9788778772732. 2008. p. 307. |
Subscribe to get information about products and offers.